
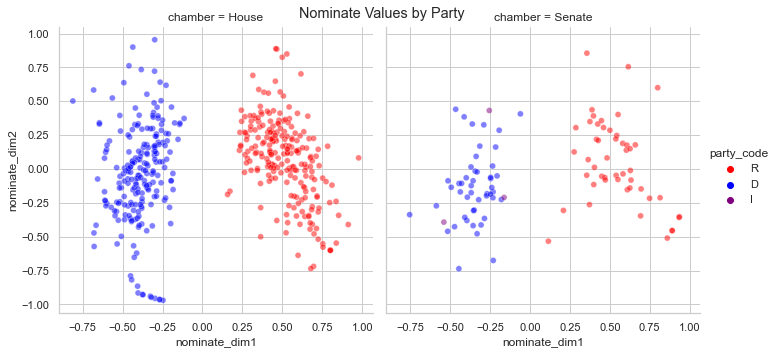
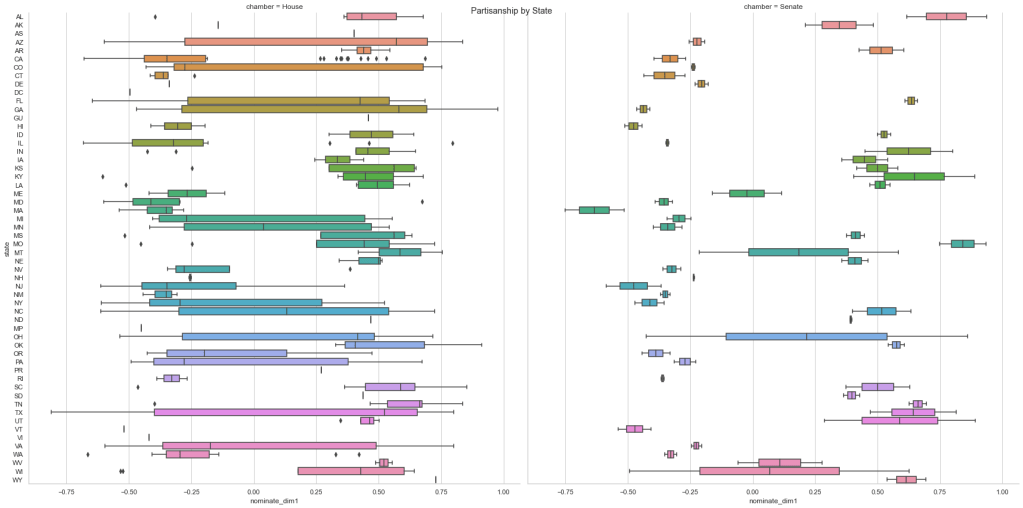
If you are a reader of data journalism, it’s likely you’ve seen partisan scores quantified; odds are, those partisan scores were generated with DW-Nominate. DW-Nominate comes from the NOMINATE family of multidimensional scaling applications, developed by Keith T. Poole and Howard Rosenthal in the 1980s. NOMINATE applications use roll call voting data (or the individual yea-nay votes made by each Congressman on each roll call) to estimate how conservative or liberal each Congressman is relative to a central point (0,0). It then assigns every Congressman two scores between -1 and 1 (represented like coordinate points – x,y), with -1 being most liberal and 1 being most conservative.
The first score (the “x” in the x,y coordinate system) represents the traditional liberal-conservative economic divide we are all most familiar with. The second score (the “y” in the x,y coordinate system) represent positions on current and particularly salient issues. In the past, these issues could have been slavery, prohibition, women’s suffrage, or civil rights. Today, particularly salient issues are more numerous, less nuanced, and significantly more transient, meaning that the y scores change frequently depending on what was most recently voted on. For this set, you can safely assume that current issues include abortion, climate policy, and foreign policy – particularly related to China.
DW-Nominate scores for the 118th Congress are visualized by legislator and by state below:
For those of you who don’t want to get too deep into the weeds, you now know enough to confidently interpret NOMINATE applications. Pretty much every time you see someone quantify Congressional partisanship, they are using a Nominate, W-Nominate, or DW-Nominate scaling method. With what you have read so far, I am confident that you now grasp what those scores mean far more than the average news consumer. If you want to test your NOMINATE knowledge, you can view the project I did for my research fellowship that focused on a one-dimensional application of W-Nominate to the Oklahoma State Legislature here.
But, for those of you who just can’t get enough of the math, keep reading!
Multidimensional scaling applications make 2 main assumptions:
- Dichotomous choices exist in a two-dimensional Euclidian space (a typical x-y graph for the less pretentious among you)
- Each actor in the given Euclidian space has an ideal point, and all actions they make are normally distributed around that ideal point
NOMINATE throws in one more – all Congressional partisanship can be quantified by no more than 2 dimensions.
This R package documentation explains the actual math quite eloquently and I would not do the equations the same justice, so I have hyperlinked it instead of rehashing it here.
So what do the NOMINATE scores mean for those of you with a hankering for math? Essentially, NOMINATE assumes that all legislators have an ideal point, and all of their rollcall voting decisions are distributed normally around that ideal point – this was one of the multidimensional scaling assumptions we discussed earlier. NOMINATE modifies the spatial model of voting by optimizing for the center of the gaussian ideal point distribution and producing a single number instead of a range. This is useful because a single point is far more readable than a range on a visualization or a chart. Single points also allow for linear models to be built using NOMINATE scores.
I hope you enjoyed this more mathematical post today. I know it’s different from what I usually write about, but I am passionate about numeracy and believe that understanding statistics is an important part of being well informed.
Thanks for reading and I’ll see you next week. Thanks for reading and don’t forget to subscribe!

Leave a comment