
Political psychology has been one of the preeminent topics in the social sciences for the last several decades. Many prominent scholars – my favorite among them being Johnathan Haidt – have dedicated their academic careers to studying the neurological differences between Democrats and Republicans. From Theodor Adorno’s F Scale to measurable differences in openness and contentiousness (with liberals being more open and less contentious, and vise versa for conservatives), the literature has made it abundantly clear that personality has a major impact on voting behavior.
In this week’s newsletter, I want to dive into a super simple element of political psychology: optimism. Optimism has been called a “key factor” in determining voter turnout, with optimistic people often voting more than their pessimistic peers.
To visualize optimism differences between the two political parties, I used data from the ANES ranging from 2008-2020. The four variables I highlighted were general economic confidence, recorded as the respondent’s prediction of the coming year’s economic conditions on a 1-3 ordinal scale; personal economic confidence, recorded as the respondent’s prediction of their personal financial situation in the coming year on a 1-3 ordinal scale; trust in others, recorded as a 1-5 rating of how much the respondent trusts other people; and satisfaction with life, recorded as a 1-5 rating of how satisfied the respondent is with their life. All of these measures have been categorized by dichotomous party identification (only self-identified Democrats and Republicans were included), mutated to a 1-10 scale to improve inter-chart comparability, and interpolated between election years to improve readability. See below:
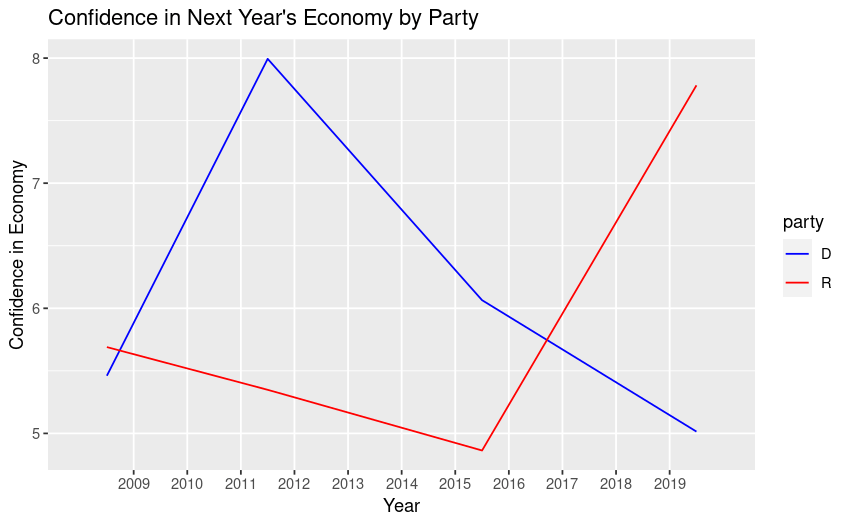

These first two charts represent measures of economic optimism, and a couple of very interesting things stick out to me when viewing them. First, economic optimism seems to be related to the party of the president in power. In the first two charts, Democrats are more confident about the economy than Republicans until around 2016 when Trump was elected. Despite what the chart may initially tell you, Democrats were likely not losing economic confidence under Obama; the descending line from 2012 to 2016 is a function of the limitations of a time-series plot with sporadic data intervals – do not let the interpolation of the line graph fool you here.
Likewise with the personal financial situation chart, Democrats were more optimistic under Obama and less optimistic under Trump. Because my data here is limited to 2008 and later, only one election cycle is visualized. I would expect that the correlation between party optimism and president in power would continue if the graph was extended further back in time. I intend on remaking these charts with extended time-series data, and will post them on my Instagram. Follow @datadrivenpolitics to see these when I make them sometime next week (and please excuse my shameless plug).
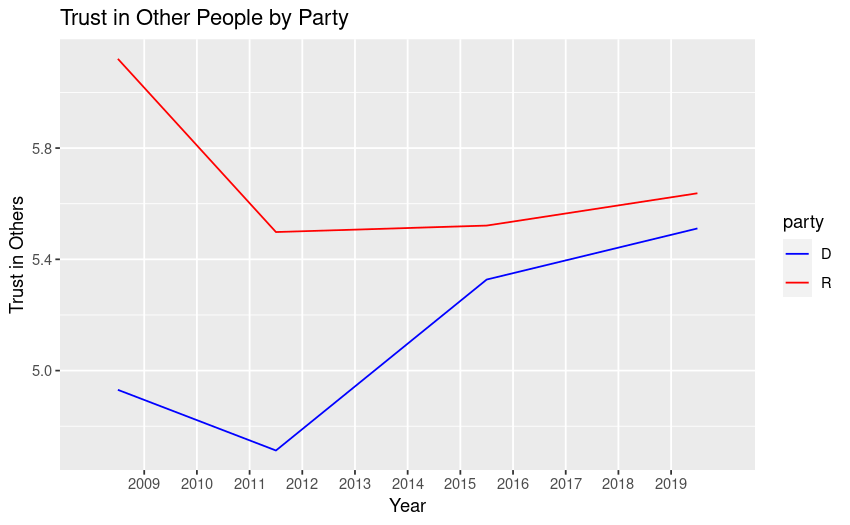
These other charts represent optimism more generally. The third chart (trust in other people) is very interesting to me, because the literature has associated Democrats with high openness to experience, a trait usually linked with trust in others. An incredibly important note with this chart is the scale of the Y-Axis, however. The difference in trust in others between Democrats and Republicans in this sample appears to have peaked at less than a 10% margin. To me, this indicates that while a relationship between party and trust likely exists, it is small at best.
I attribute this relationship mostly to political demography. In aggregate, women are more likely to be Democrats than men, and women are also less likely to be trusting of others than men. In that same vein, people of color are much more likely to be Democrats than their white peers, and like women relative to men, they are also less trusting than white people on average.
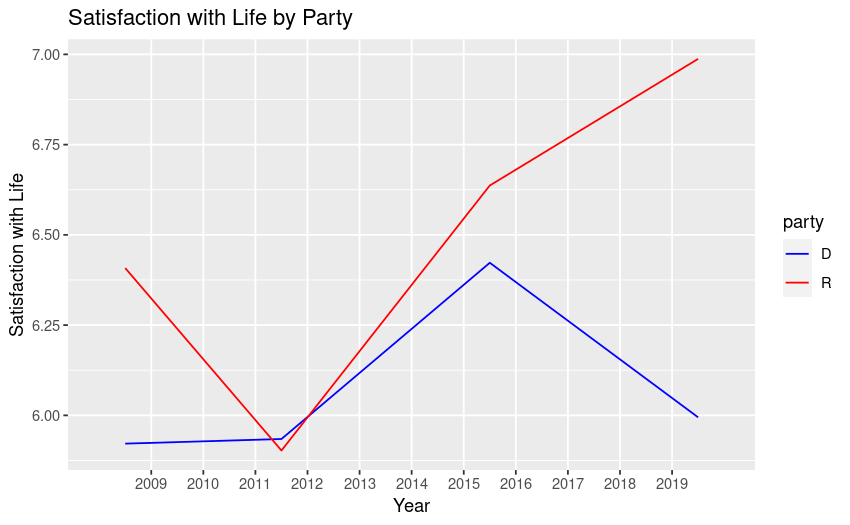
I suspect a similar effect is at play for satisfaction with life. Women; gender, racial, religious, and ethnic minorities; and other marginalized groups traditionally affiliated with the Democratic Party are understandably less satisfied with their lives than their white male peers. The lifetime psychological wear-and-tear of microaggressions are well documented in the academic literature, and wealth disparities between white men and minority groups also likely exacerbate this difference in life satisfaction between the parties.
The demographic explanation of optimism disparities mostly satisfies me, but I am still left with one big question: why do the “I am your retribution” politics of Donald Trump appeal so well to Republicans if they are more likely to report satisfaction with their lives, trust in others, and recently more economic optimism? My hypothesis is racial resentment.
I am intentionally leaving this on a cliff-hanger to drive traffic to my next post: part-two of this story and a deep-dive into the well-established associations between the Republican Party and racism. I hope you subscribe and stick around for next week’s newsletter – its gonna be a spicy one!
Best wishes and have a great week. Thanks for reading.

Leave a comment